


At a glance
- Program: English 3D
- Subject: English Language Development
- Report Type: Efficacy Study
- Grade Level: Middle
- Region: Midwest
- Population: Free or Reduced-Price Lunch, English Learners, Students with Disabilities
- Race/Ethnicity: Hispanic
- District Urbanicity: Suburban
- District Size: Large
- Implementation Model: 40-59 Minutes
The Community Consolidated School District 15 (CCSD 15) is a public school district in the northwestern suburbs of Chicago, Illinois. With 20 schools, the CCSD 15 served 11,477 pre-K through eighth-grade students in the 2020–2021 school year, 11,080 students in the 2021–2022 school year, and 11,037 students in the 2022–2023 school year[1]. The CCSD 15 served students with a range of ethnic backgrounds in the 2020–2021 through 2022–2023 school years: African American (3.6%–4.4%), Asian or Pacific Islander (18.5%–19.1%), Caucasian (38.5%–38.7%), Hispanic (33.9%–34.9%), Native American (0.3%–0.4%), and students with multiple ethnic backgrounds (3.5%–4.1%). In the 2020–2021 through 2022–2023 school years, 28.5%–29.8% of students were English learners (EL), 35.0%–40.6% of students were identified as low-income, and 11.0%–12.9% had an Individualized Education Plan (IEP).
[1] Palatine CCSD 15 District snapshot found at https://www.illinoisreportcard.com
CCSD 15 students in grades seven and eight were placed in English language development services based on scores on the state-approved ACCESS for ELLs English Language Proficiency assessment. Beginning in the 2020–2021 school year, higher-performing EL students who had lived for three or more years in the United States (long-term English learners) and scored an ACCESS for ELLs overall composite score of 2.0–4.7 and an ACCESS literacy composite score of 3.5–4.7 were placed in English 3D instruction in addition to a regular English Language Arts class. In the 2021–2022 school year, lower-performing EL students were also placed in English 3D instruction in addition to a regular English Language Arts class. In the 2022–2023 school year, English 3D participants were primarily lower-performing EL students. An ACCESS for ELLs overall composite score of 4.8 was used as the English 3D and EL exit criteria for each year.
These EL students received regular 45-minute ELA instruction using a district-created Lucy Calkins and Amplify program as well as 42-minute English 3D instruction daily. In this Single Period Instruction Model, students progressed through English 3D lessons consisting of 14 Instructional Routines to build essential skills that were used flexibly by the teacher. During the 2020–2021 school year, CCSD 15 students used English 3D during both in-person and hybrid learning; students resumed in-person learning for the 2021–2022 school year and beyond.
Dr. Kate Kinsella, English 3D author, and her team provided initial implementation training for CCSD 15 EL teachers over four full-day training sessions and one virtual coaching session. During the 2023–2024 school year, new teachers received three full-day training sessions and veteran teachers received two full-day training sessions. Implementation materials include a teaching guide outlining the three essential routines (partner and group interactions, response frames, and setting up and monitoring tasks), key EL instruction techniques, use of English 3D assessment and differentiated learning materials, and a planning guide. During the initial professional learning session, EL teachers go over the teaching guide and available resources in addition to discussing how to establish a learning environment customized to EL instruction and experiencing a model lesson of each type of instructional routine from the student perspective.
“The most useful resources in English 3D are the instructional routines including the partner and group interactions, using response frames, and setting up and monitoring tasks. All of the instructional routines were critical in our students’ success as it truly facilitated the academic language development in the four domains of language.” - CCSD 15 employee
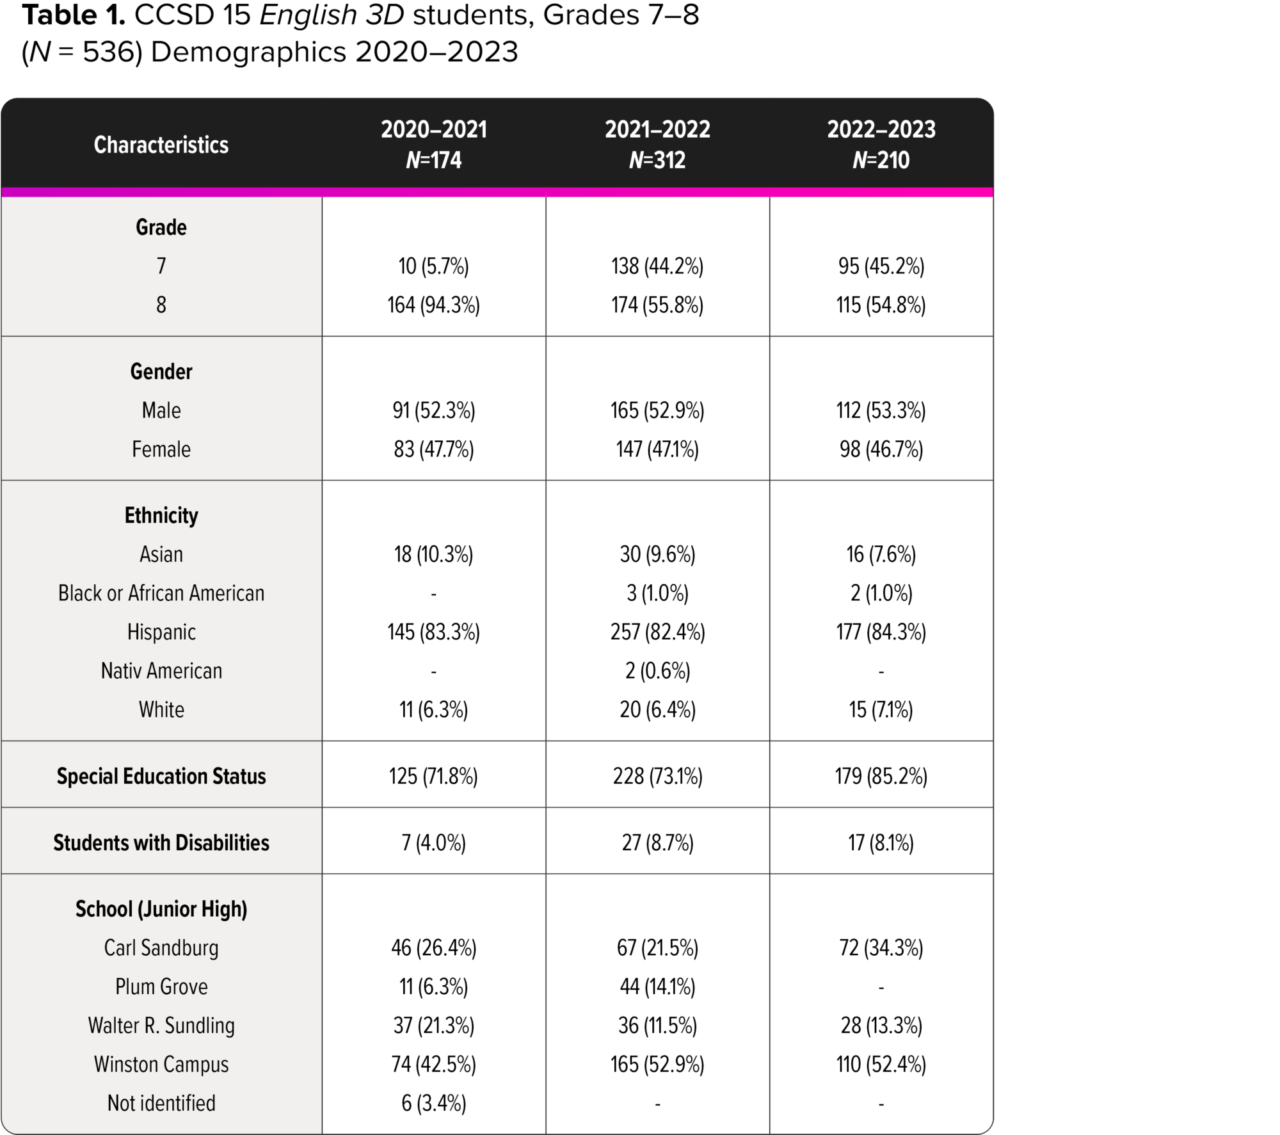
Four schools in the CCSD 15 serving students in grades seven and eight during the 2020–2021 and 2021–2022 school years and three schools during the 2022–2023 school year utilized English 3D as a reading intervention. All students who were enrolled in the English 3D course (as denoted in district-provided data) with outcome measure data were included in the analysis (N=536). Students did not simultaneously participate in other reading interventions.
As mentioned, the characteristics of the participants targeted for English 3D reading intervention changed from the first to second and third year of use in the CCSD 15. In the first year, participants were primarily high-performing eighth-grade EL students. In the second and third year, participants included both low- and high-performing EL students, with equal inclusion of both seventh- and eighth-grade students, and double the percentage of students classified as Students with Disabilities. In the third year, participants primarily included low-performing EL students. In the 2020–2021, 2021–2022, and 2022–2023 school years, students in this analysis attended Carl Sandburg Junior High (22%–34%), Plum Grove Junior High (0%–14%), Walter R. Sundling Junior High (12%–21%), and Winston Campus Junior High (43%–53%), and included seventh- (6%–45%) and eighth-grade (55%–94%) students. Student ethnic backgrounds included Asian (8%–10%), Black or African American (0%–1%), Hispanic (82%–84%), Native American (0%–0.6%), and White (6%–7%). Of these students, 47%–48% were female and 52%–53% were male, 4%–9% were classified as Students with Disabilities (SWD), and 72%–85% were socio-economically disadvantaged (qualified for free or reduced-priced lunch).
Measures of Academic Progress (MAP) Reading
Measures of Academic Progress (MAP®) is a computer-adaptive interim (fall, winter, and spring) assessment developed by the Northwest Evaluation Association that measures reading, language usage, and mathematics. The primary score produced is the RIT (Rasch Unit) scale, which is a stable equal-interval vertical scale. This grade-independent RIT score indicates the level of question difficulty a given student can answer correctly about 50% of the time. Percentile ranks for the MAP are also provided. CCSD 15 students completed the MAP Reading assessment in the fall and spring of each school year.
ACCESS FOR ELLs
ACCESS for ELLs®, a part of the WIDA® suite of English language development tests, was designed to annually assess the progress of EL students towards English language proficiency. ACCESS for ELLs is aligned to WIDA English language development standards and assesses progress in the four domains of listening, speaking, reading, and writing English. Assessment results include an overall scale score comparable across grades (from 100-600) and a grade-specific proficiency level descriptor for each domain (Entering, Emerging, Developing, Expanding, Bridging, and Reaching) as well as an overall composite score (35% reading, 35% writing, 15% listening, and 15% speaking) and related overall composite proficiency level. Students remain in EL services until an ACCESS for ELLs overall composite proficiency level of 4.8 is achieved (the mandated exit criteria). CCSD 15 students designated as EL completed the ACCESS for ELLs in the spring of each school year.
Illinois Assessment of Readiness (IAR)
The Illinois Assessment of Readiness (IAR) assesses student progress in meeting the Illinois English language arts and literacy learning standards. Assessment results include a scale score comparable within grades (reported on a scale from 650–850) and Performance Level Descriptors (PLDs; Did not yet meet, Partially met, Approached, Met, and Exceeded Expectations) with a Met (4) or higher score indicating readiness for the next grade level. Scale scores for the reporting categories of Reading (literary text, informational text, and vocabulary skills reported on a scale from 10–90 with scores of 50 meeting grade-level requirements) and Writing (written expression and knowledge and use of English language conventions skills reported on a scale from 10–60 with scores of 35 meeting grade-level requirements) are also provided. CCSD 15 students completed the IAR in the spring of each school year.
An independent evaluator from Forge Research Group analyzed student academic achievement using test score data provided by the CCSD 15. English 3D students’ English Language Arts (ELA) performance was examined using multiple independent measures of reading and language. This analysis included pre- and post-implementation scores on the MAP Reading assessment and post-implementation scores on the ACCESS and the IAR state assessment. Based on the available data, English 3D students achieved accelerated ELA gains as compared to a national sample of initially same-scoring peers and demonstrated growth comparable to non-EL students.
“Overwhelmingly, the teachers reported that [English 3D] was an effective program for our ELs as we began with Language Launch during hybrid learning and throughout the pandemic.” - CCSD 15 employee
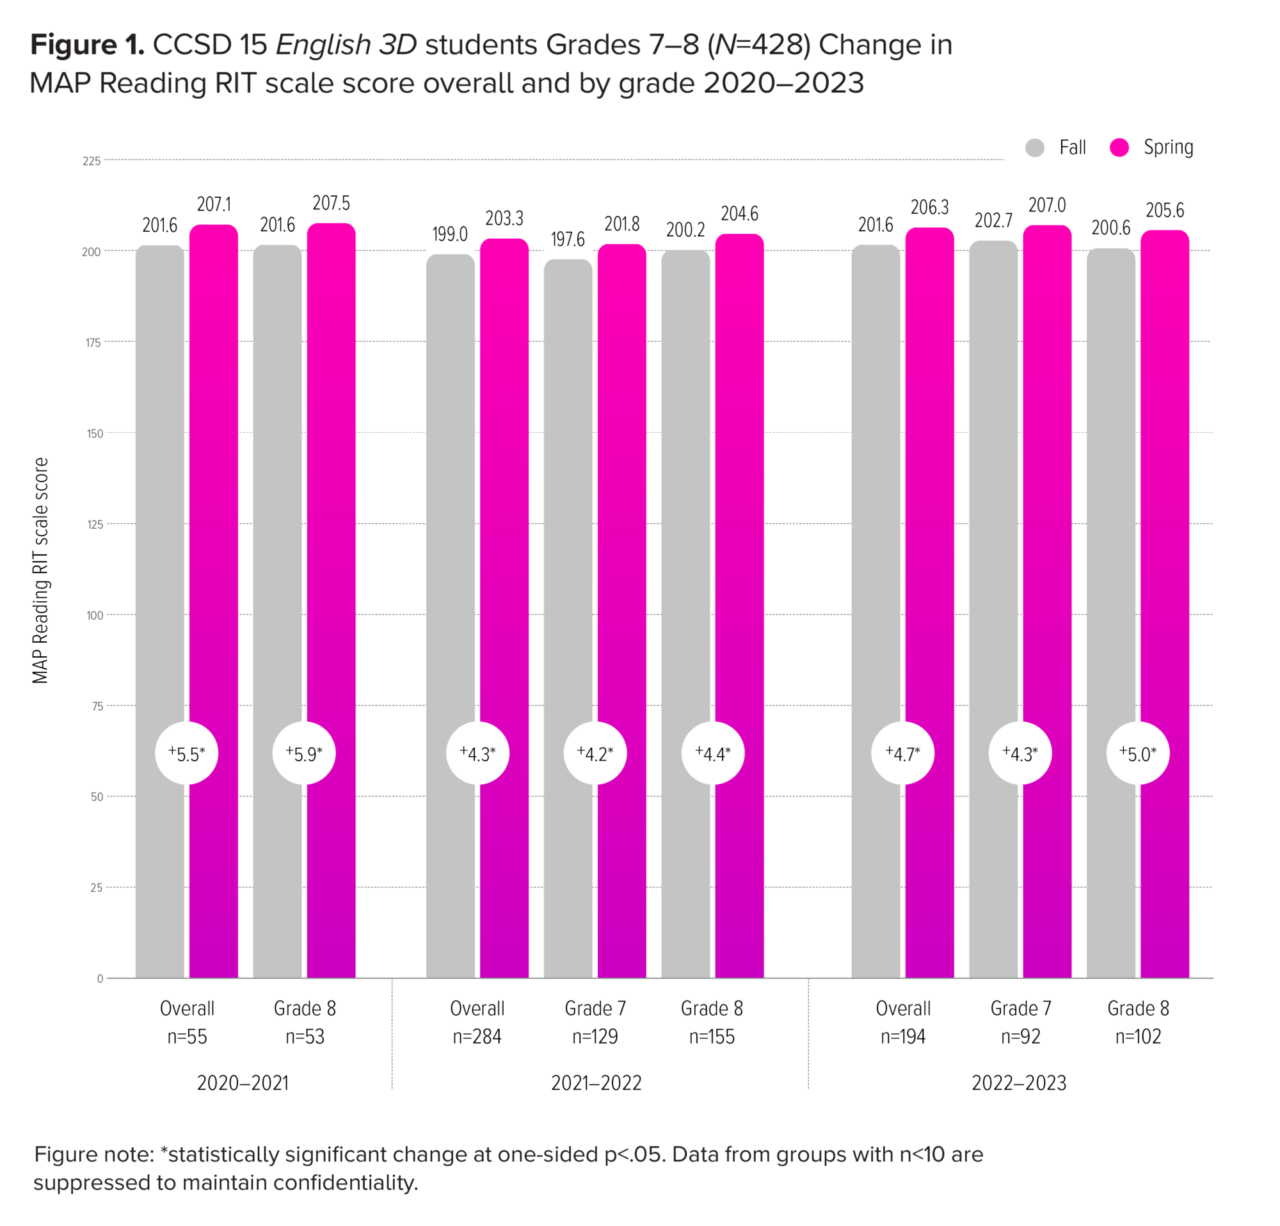
CCSD 15 students take the Measures of Academic Progress (MAP) Reading assessment in the fall and spring. MAP assessments are aligned to the Common Core State Standards (CCSS) and measure student growth in skills needed to do well on end-of-year CCSS assessments (i.e., the IAR). CCSD 15 English 3D students demonstrated a statistically significant overall increase in MAP Reading RIT scale scores, averaging a 6-point gain overall from fall to spring in the 2020–2021 school year with effect size Cohen’s d=.51, a 4-point gain in the 2021–2022 school year with effect size Cohen’s d=.47 , and a 5-point gain in the 2022–2023 school year with effect size Cohen’s d=.54 (see Figure 1). These statistically significant gains were seen with students in both the seventh (effect size Cohen’s d=.44–.60) and eighth grades (effect size Cohen’s d=.51–.56).
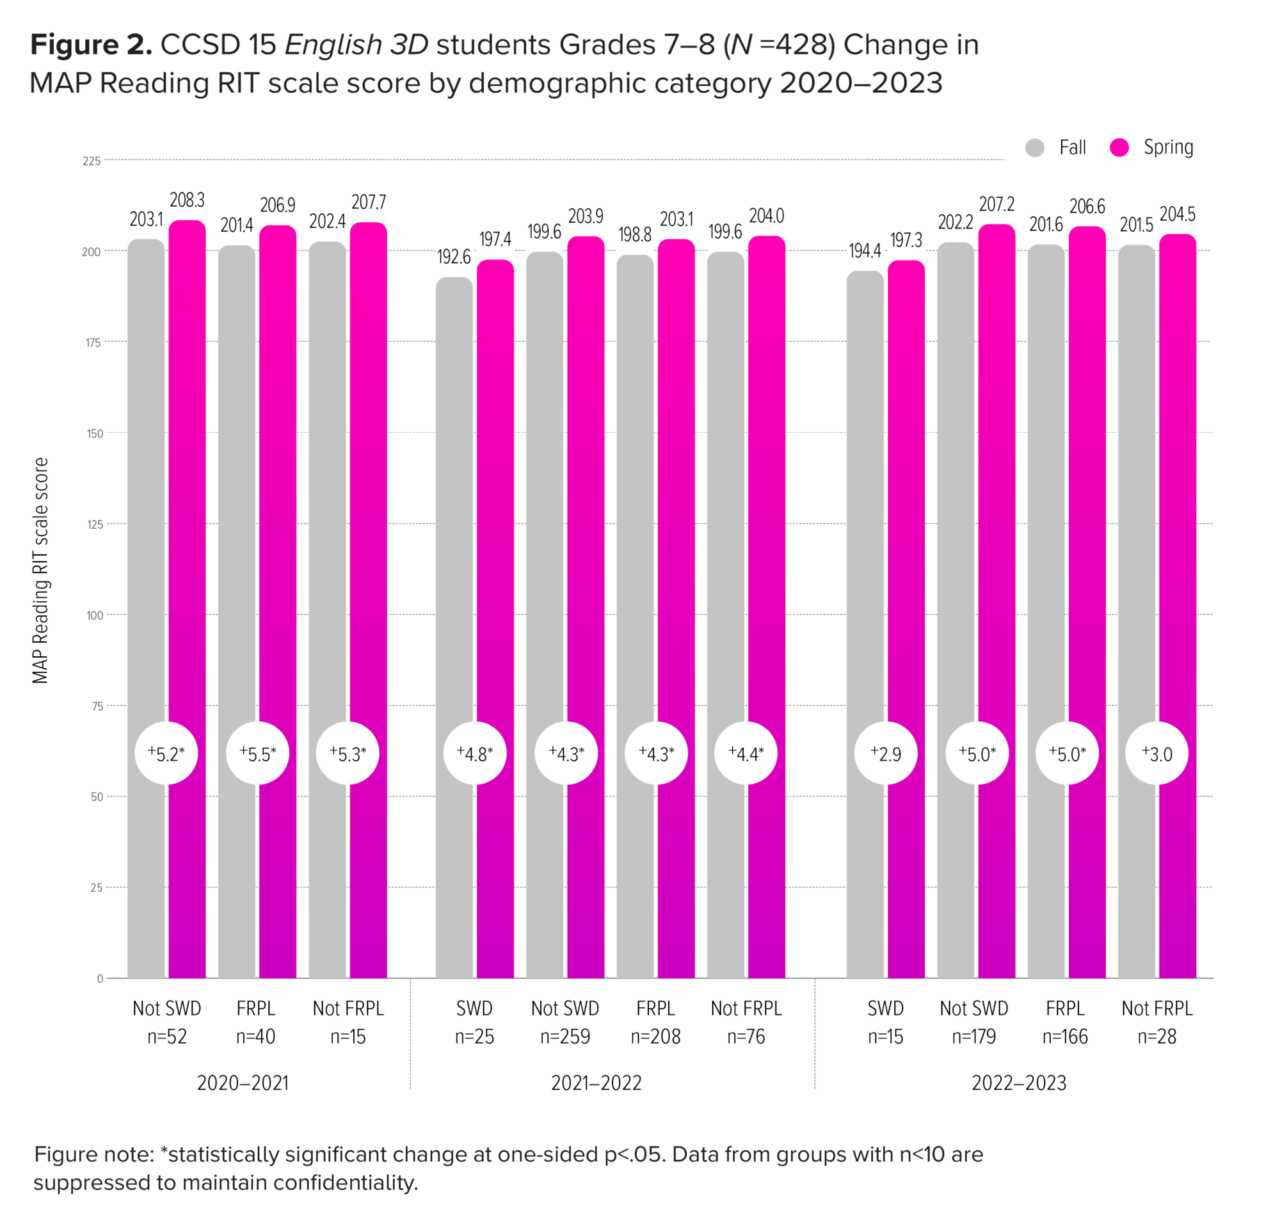
When yearly results were disaggregated by gender, both males (effect size Cohen’s d=.47–.68) and females (effect size Cohen’s d=.26–.62), and students of all ethnic backgrounds (effect size Cohen’s d=.49–1.04), achieved statistically significant MAP Reading RIT scale score gains (see Appendix Table 1). Likewise, both students qualified for FRPL (effect size Cohen’s d=.50–.59) and those not qualified for FRPL (effect size Cohen’s d=.29–.51) as well as students classified as SWD (effect size Cohen’s d=.41–.63) and those not classified as SWD (effect size Cohen’s d=.46–.55) achieved statistically significant MAP Reading RIT scale score gains (see Figure 2 and Appendix Table 1).
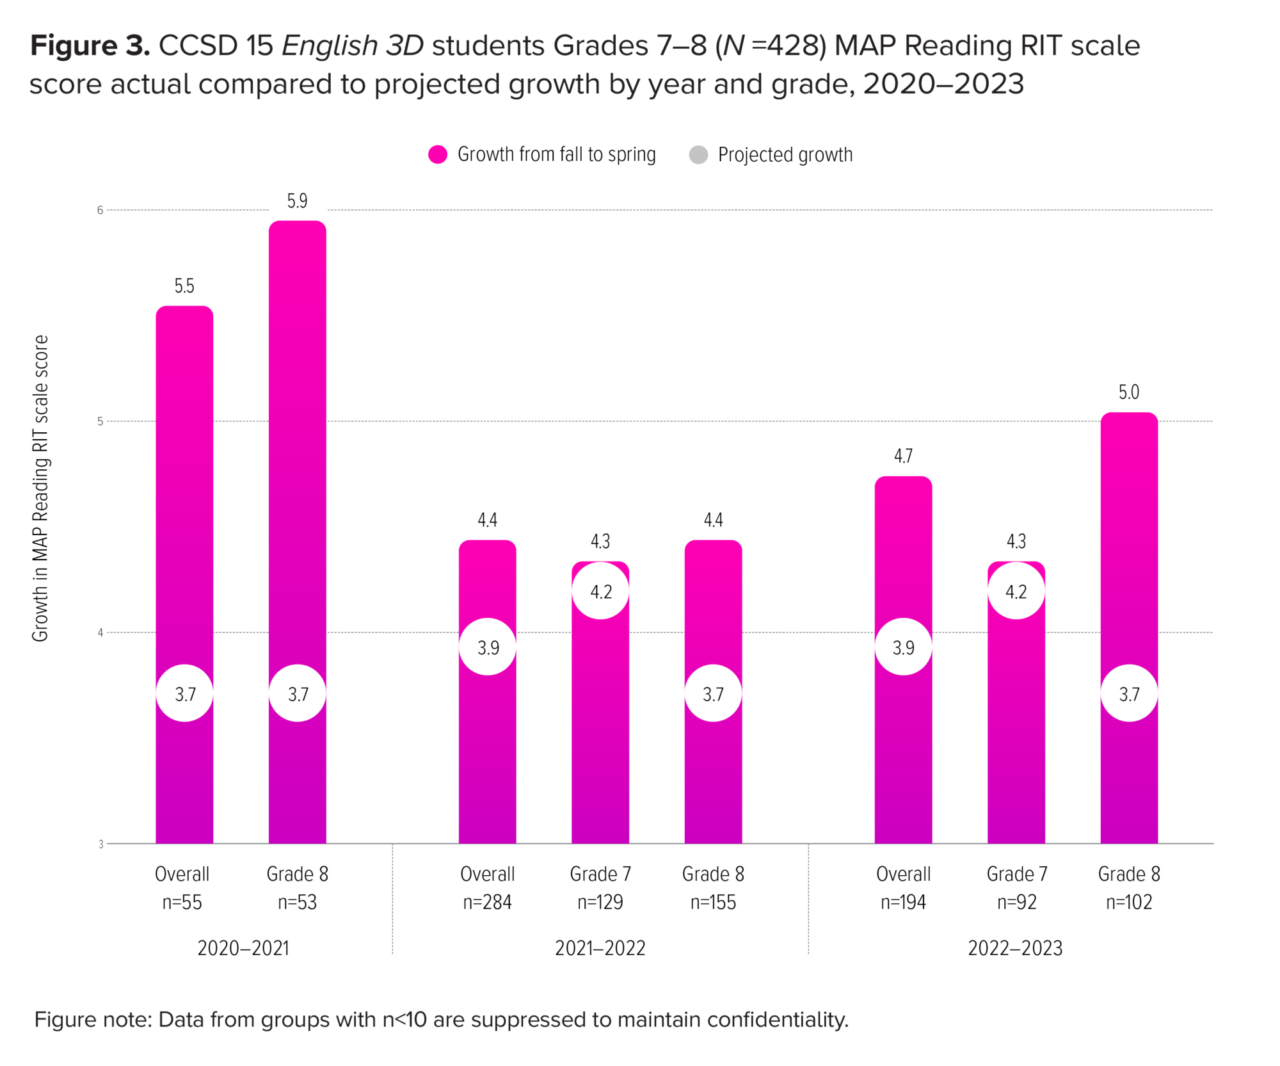
In contrast to national EL student trends of diminished ELA growth (NAEP, 2017), CCSD 15 English 3D students met or exceeded national MAP Reading growth projections[2] in each school year (see Figure 3). CCSD 15 English 3D students averaged 1.5 times more growth than expected (5.5 points of growth compared to 3.7 points expected growth) in the 2020–2021 school year, 1.1 times more growth than expected (4.4 points of growth compared to 3.9 points expected growth) in the 2021–2022 school year, and 1.2 times more growth than expected (4.7 points of growth compared to 3.9 points expected growth) in the 2022–2023 school year. Anecdotally, accelerated MAP Reading RIT scale score gain was most pronounced in schools that completed more English 3D issues. Additionally, one school with more teacher re-assignments showed less-than-expected growth; when that school’s data was excluded from the analysis, CCSD 15 English 3D students exceeded national MAP Reading growth averages with a 5.3-point gain in the 2021–2022 school year (statistically significant at p<.05).
“The students developed a higher level of academic vocabulary through their speaking and writing skills. The productive partnering and ten-minute responses were strategic in developing those higher-level skills.” – CCSD 15 employee
[2] A student’s projected RIT growth is the predicted future score for a student who makes typical growth, based on NWEA national growth norms. Projections account for the student’s initial score, grade level, and time between tests.
MAP percentile scores represent a student’s position relative to their national peer group; if a student shows typical growth over the course of the school year, their percentile rank will remain the same from fall to spring. On average, CCSD 15 English 3D students scored better than 28.1% of their Illinois state peers in fall 2020 and 28.1% of their Illinois state peers in spring 2021. English 3D students scored better than 20.6% of their Illinois state peers in fall 2021 and 21.4% of their Illinois state peers in spring 2022. English 3D students scored better than 24.3% of their Illinois state peers in fall 2022 and 25.9% of their Illinois state peers in spring 2023. Typically, the reading achievement gap widens between students classified as EL and non-EL students during the junior high school years (NAEP, 2017). These results indicate that, contrary to typical outcomes, CCSD 15 English 3D junior high EL students demonstrated grade-level growth comparable to non-EL students in the 2020–2021, 2021–2022, and 2022–2023 school years. Further, 27% of students in the 2020–2021 school year, 19% of students in the 2021–2022 school year, and 22% of students in the 2022–2023 school year gained at least 10 percentile points from fall to spring, demonstrating accelerated ELA growth.
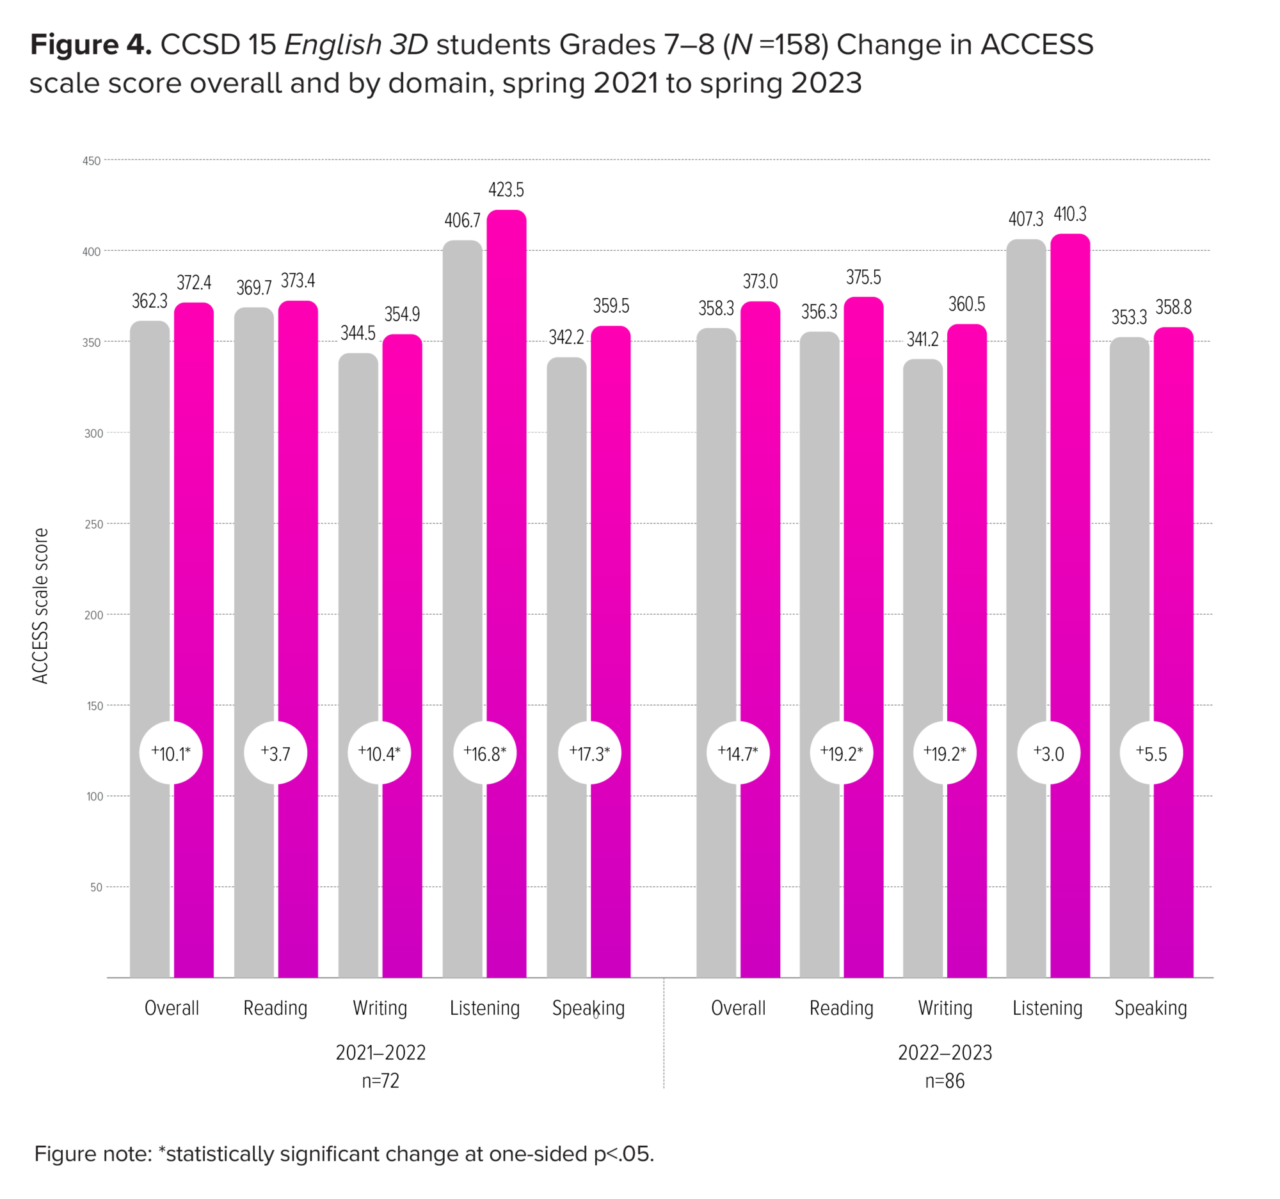
English 3D students completed the ACCESS in May 2021, January 2022, and January 2023 after English 3D implementation. On average, students who took the assessment in both the 2020–2021 and 2021–2022 school years (N=72; see Figure 4) demonstrated statistically significant year-to-year increases in overall scale scores (from 362 to 372, effect size Cohen’s d=.65), writing domain scores (from 345 to 355, effect size Cohen’s d=.44), listening domain scores (from 407 to 424, effect size Cohen’s d=.45), and speaking domain scores (from 342 to 360, effect size Cohen’s d=.41), as well as notable growth in reading domain scores (from 370 to 373, effect size Cohen’s d=.15). Similarly, students who took the assessment in both the 2021–2022 and 2022–2023 school years (N=86) demonstrated statistically significant year-to-year increases in overall scale scores (from 358 to 373, effect size Cohen’s d=.77), reading domain scores (from 356 to 376, effect size Cohen’s d=.76), writing domain scores (from 341 to 361, effect size Cohen’s d=.76), as well as notable growth in listening domain scores (from 407 to 410, effect size Cohen’s d=.08), and speaking domain scores (from 353 to 359, effect size Cohen’s d=.15).
When yearly results were disaggregated by student category, both males (Cohen’s d effect sizes .52–.76) and females (effect size Cohen’s d=.78–.88) and both students qualified for FRPL (effect size Cohen’s d=.64–.77) and those not qualified for FRPL (effect size Cohen’s d=.71–.91) achieved statistically significant year-to-year increases in ACCESS overall scale scores in the 2020–2021 to 2022–2023 school years (see Appendix Table 2).
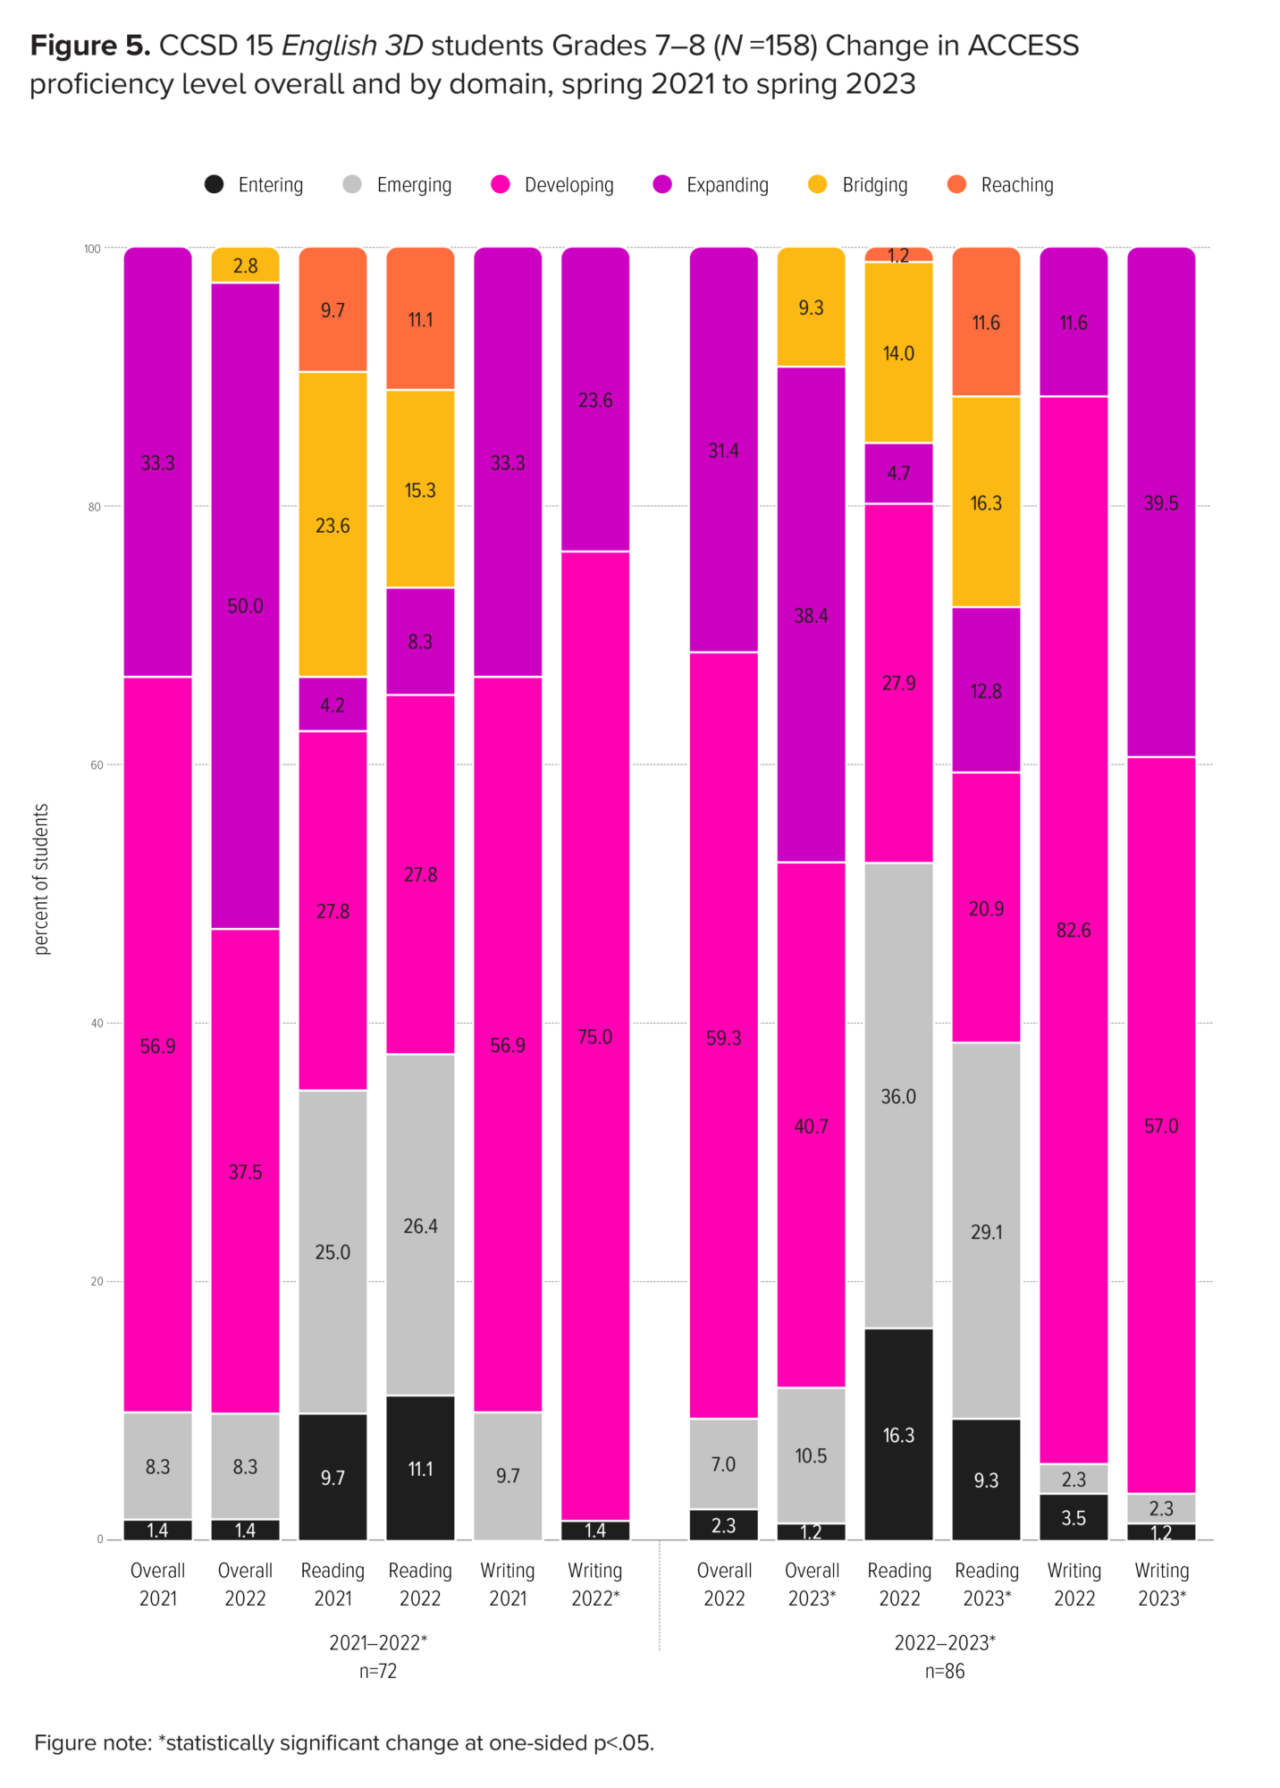
Student ACCESS proficiency levels (scored from 1-6) also reflected year-to-year growth (see Figure 5). From spring 2021 to spring 2022, English 3D students who took the assessment in both years (N=72) achieved an increase in overall composite (effect size Cohen’s d=.28), and writing (effect size Cohen’s d=.24) grade-specific proficiency levels. The percentage of students who achieved a level 4 “Expanding” or greater proficiency level increased from 33% to 53% overall and the percentage of students who achieved a level 1 “Entering” or 2 “Emerging” in writing decreased from 10% to 1%. From spring 2022 to spring 2023, English 3D students who took the assessment in both years (N=86) achieved a statistically significant increase in overall composite (effect size Cohen’s d=.54), reading (effect size Cohen’s d=.52), and writing (effect size Cohen’s d=.55) grade-specific proficiency levels. The percentage of students who achieved a level 4 “Expanding” or greater proficiency level increased from 31% to 48% overall, from 29% to 41% in reading, and from 12% to 40% in writing.
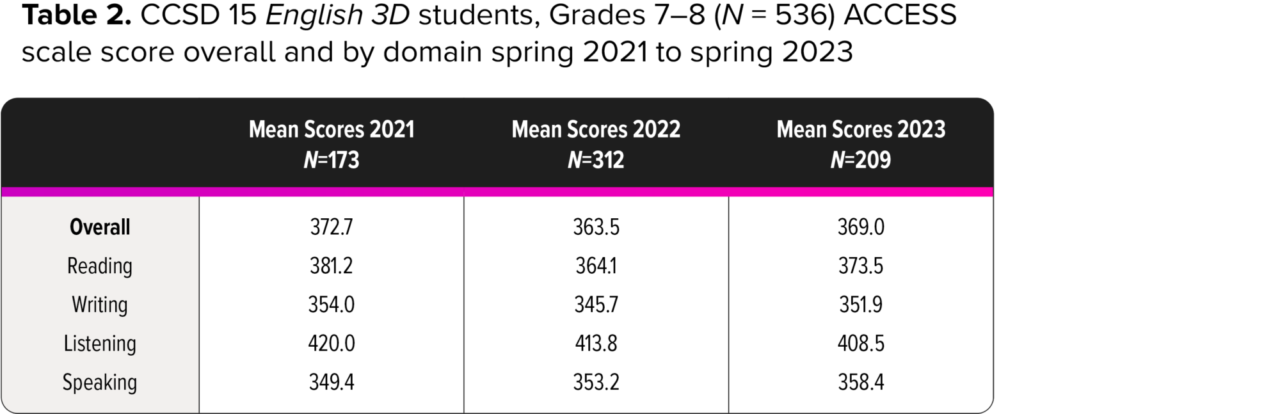
Comparing the scores of all English 3D students (N=173 in 2021, N=312 in 2022, and N=209 in 2023), ACCESS scores were slightly lower in Year 2 and Year 3 as compared to Year 1, reflecting the different populations of English 3D participants each year (see Table 2). On average, in the 2020–2021 to 2022–2023 school years, students earned overall scale scores (with 600 possible points) of 373, 364, and 369. Students averaged 381, 364, and 374 on the reading domain, 354, 346, and 352 on the writing domain, 420, 414, and 409 on the listening domain, and 349, 353, and 358 on the speaking domain (see Table 2). Importantly, 43% (74/173) of students in the 2020–2021 school year, another 19% (59/312) in the 2021–2022 school year, and 29% (60/209) in the 2022–2023 school year achieved at least a “Bridging” ACCESS Reading performance level, indicating an ability to understand written language in English from all academic classes.
“Teachers could see the use of higher levels of academic language in the other classes throughout the day.” – CCSD 15 employee
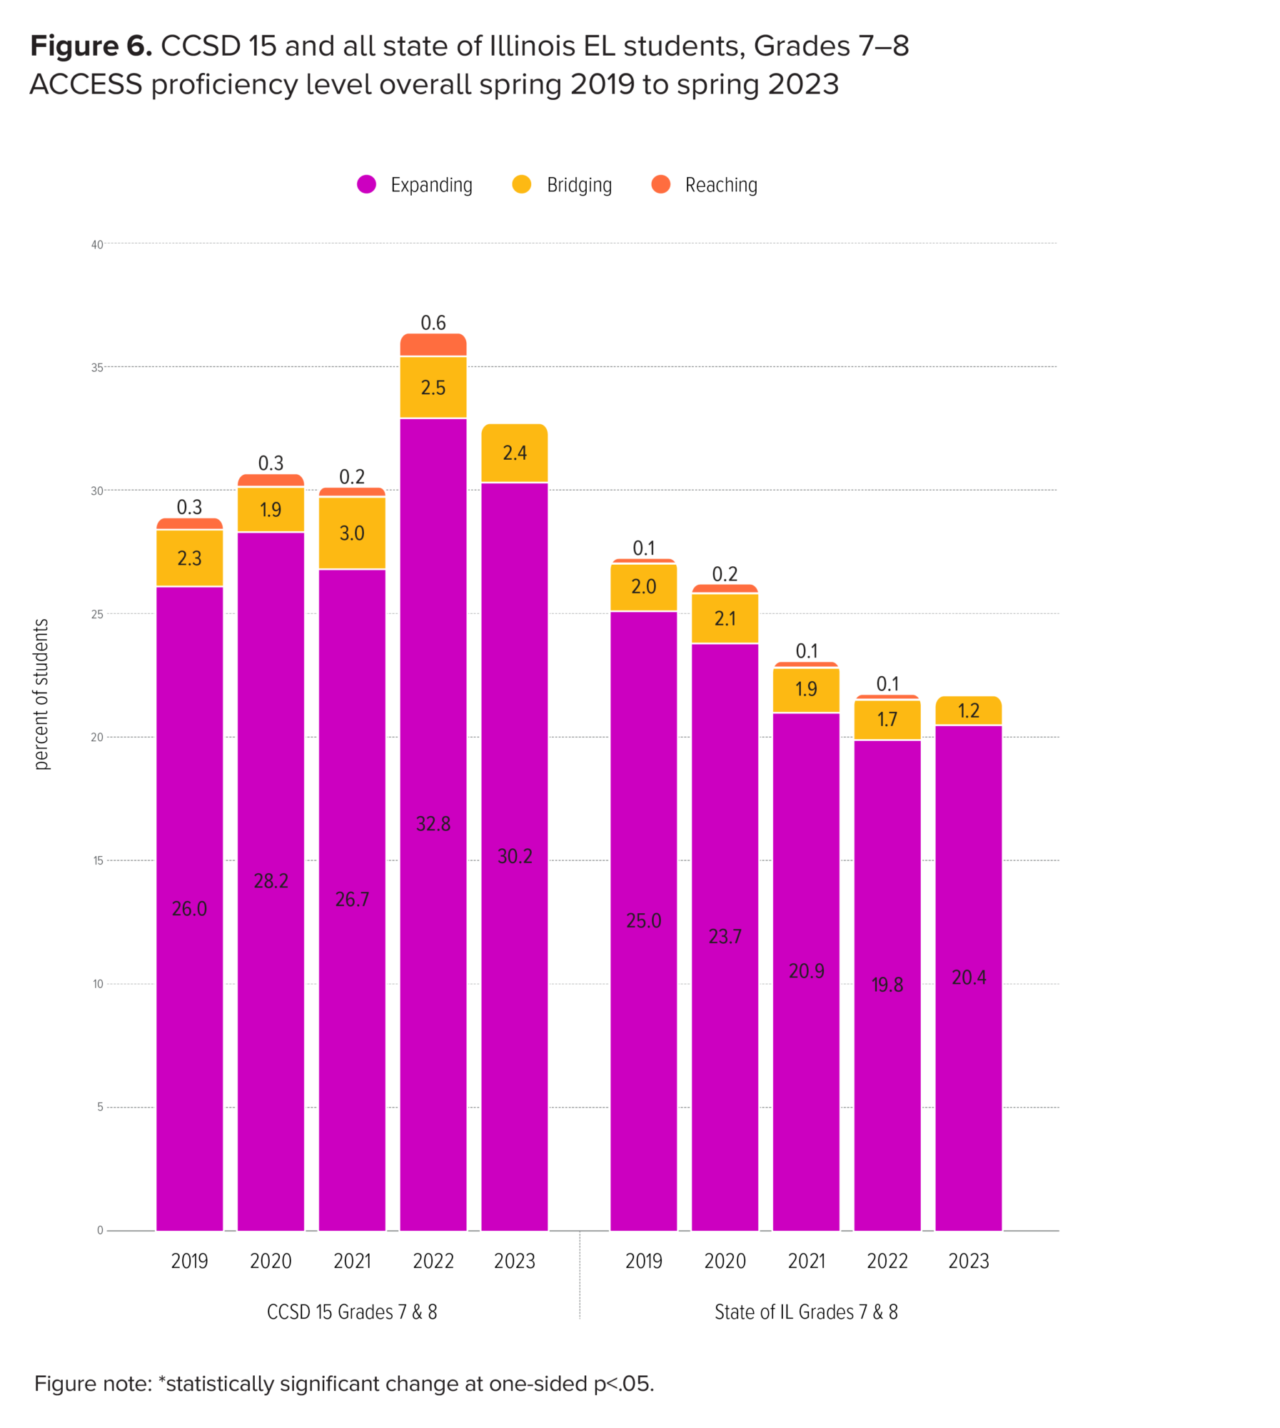
Though not every seventh and eighth grade EL student in the CCSD 15 participated in English 3D, approximately 32% participated in the 2020–2021 school year, 58% participated in the 2021–2022 school year, and 18% participated in the 2022–2023 school year. Notably, the CCSD 15 ACCESS overall composite proficiency levels increased in the year following English 3D implementation[3] (see Figure 6), from 28.6% of students achieving a 4, 5, or 6 in 2019 to 32.6% of students achieving a 4, 5, or 6 in 2023, with the largest increase corresponding to the year with the highest EL student participation rate in English 3D. In contrast, the state-wide overall composite proficiency levels steadily decreased over the past five years, from 27.1% of students achieving a 4, 5, or 6 in 2019 to 21.6% of students achieving a 4, 5, or 6 in 2023. These trends indicate that CCSD 15 EL students have maintained accelerated growth towards competency during a time when many EL students state-wide have struggled to maintain English language development growth.
[3] Student: English Learners tab accessed from https://www.illinoisreportcard.com/
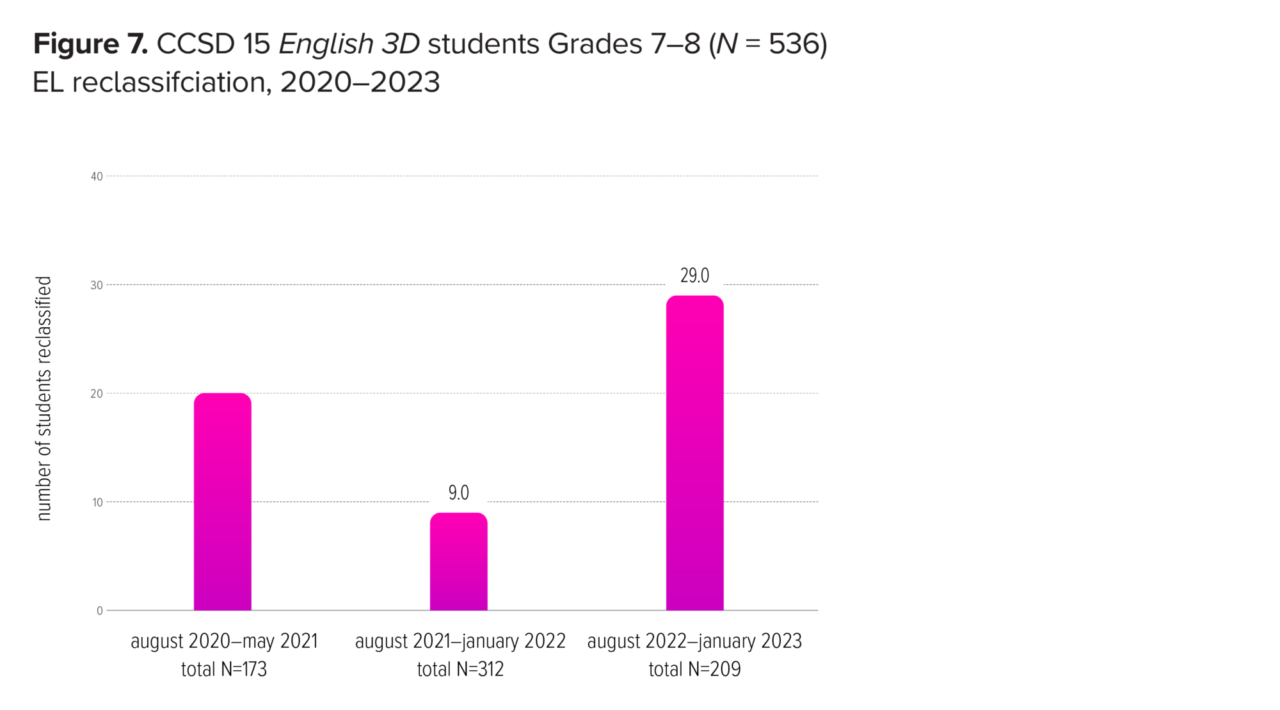
CCSD 15 EL students are reclassified once they achieve an overall composite proficiency level of 4.8 or greater (see Figure 7). From August 2020 to May 2021, 12% (20/173) of the English 3D students were reclassified and a further 17% (29/173) scored between a 4.5–4.7, approaching the EL exit criteria. From August 2021 to January 2022, 3% (9/312) of English 3D students were reclassified (reflecting the shorter time between test administrations), and a further 9% (27/312) scored between a 4.5–4.7, approaching the EL exit criteria. From August 2022 to January 2023, 14% (29/209) of the English 3D students were reclassified and a further 13% (27/209) scored between a 4.5–4.7, approaching the EL exit criteria.
“We noticed at one Junior High School that we had 13 students reach proficiency criteria [2020–2021]. The year prior, only 2 students attained proficiency. Therefore, we were certain that even during a pandemic, the language development gains were noticed and attributed to the curricular anchor of English 3D.”
– CCSD 15 employee
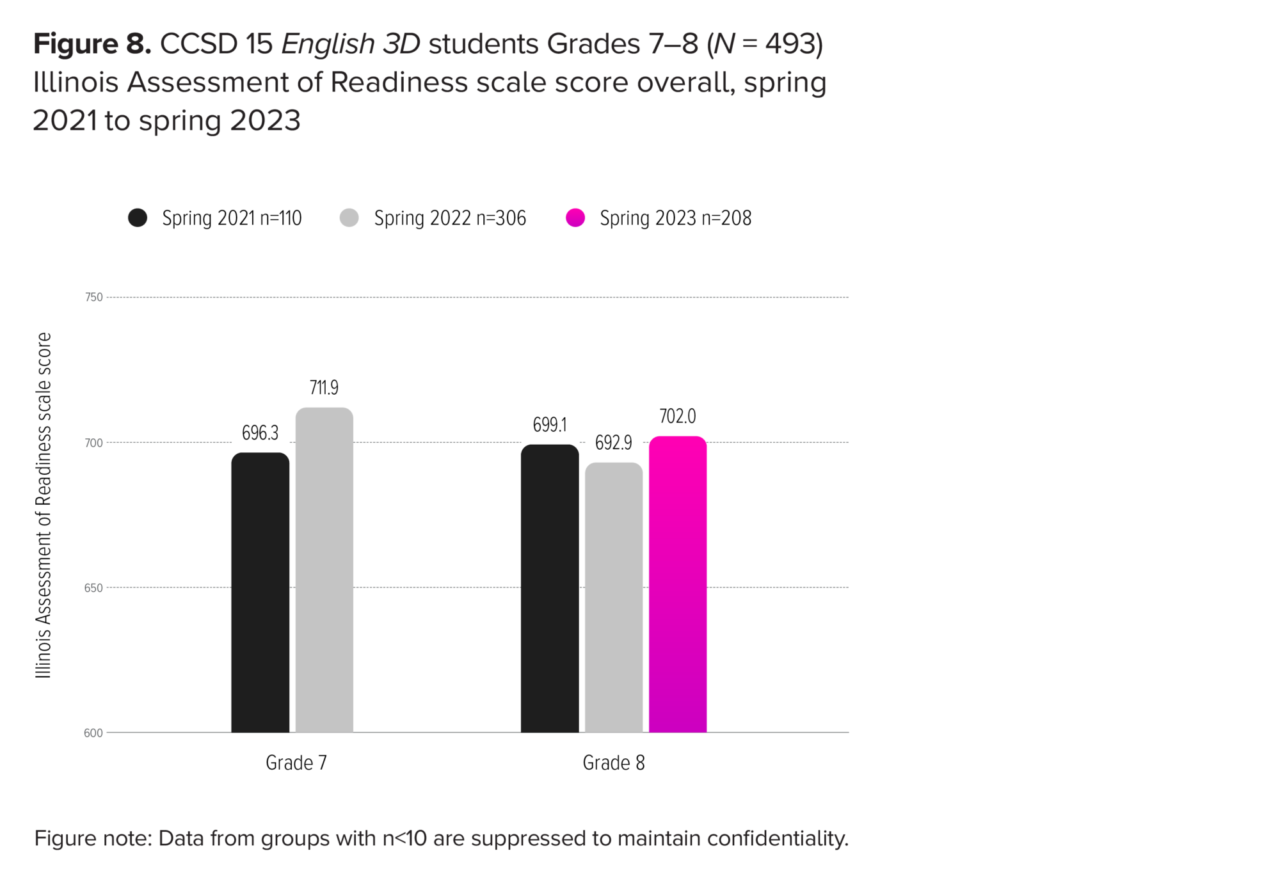
English 3D students completed the IAR at the end of the school year in 2021, 2022, and 2023. On average, seventh-grade students earned scale scores of 696 (with a possible range from 650–850 on grade-dependent scales) in the 2021–2022 school year and 712 in the 2022–2023 school year (see Figure 8). On average, eighth-grade students earned scale scores of 699, 693, and 702 in the 2020–2021 through 2022–2023 school years, respectively. Of note, English 3D students classified as SWD (n=9) who took the IAR in both years averaged a statistically significant 22-point gain in IAR scores from 677 in spring 2022 to 699 in spring 2023, effect size Cohen’s d=.93.
Notably, the percentage of English 3D students who achieved a “Met” IAR Performance Level Descriptor increased from 2% in the 2020–2021 school year to 5.3% in the 2022–2023 school year (see Figure 9). Another 20% of English 3D students “Approached” grade-level ELA expectations in the 2022–2023 school year, an increase from 18% in the 2020–2021 school year.
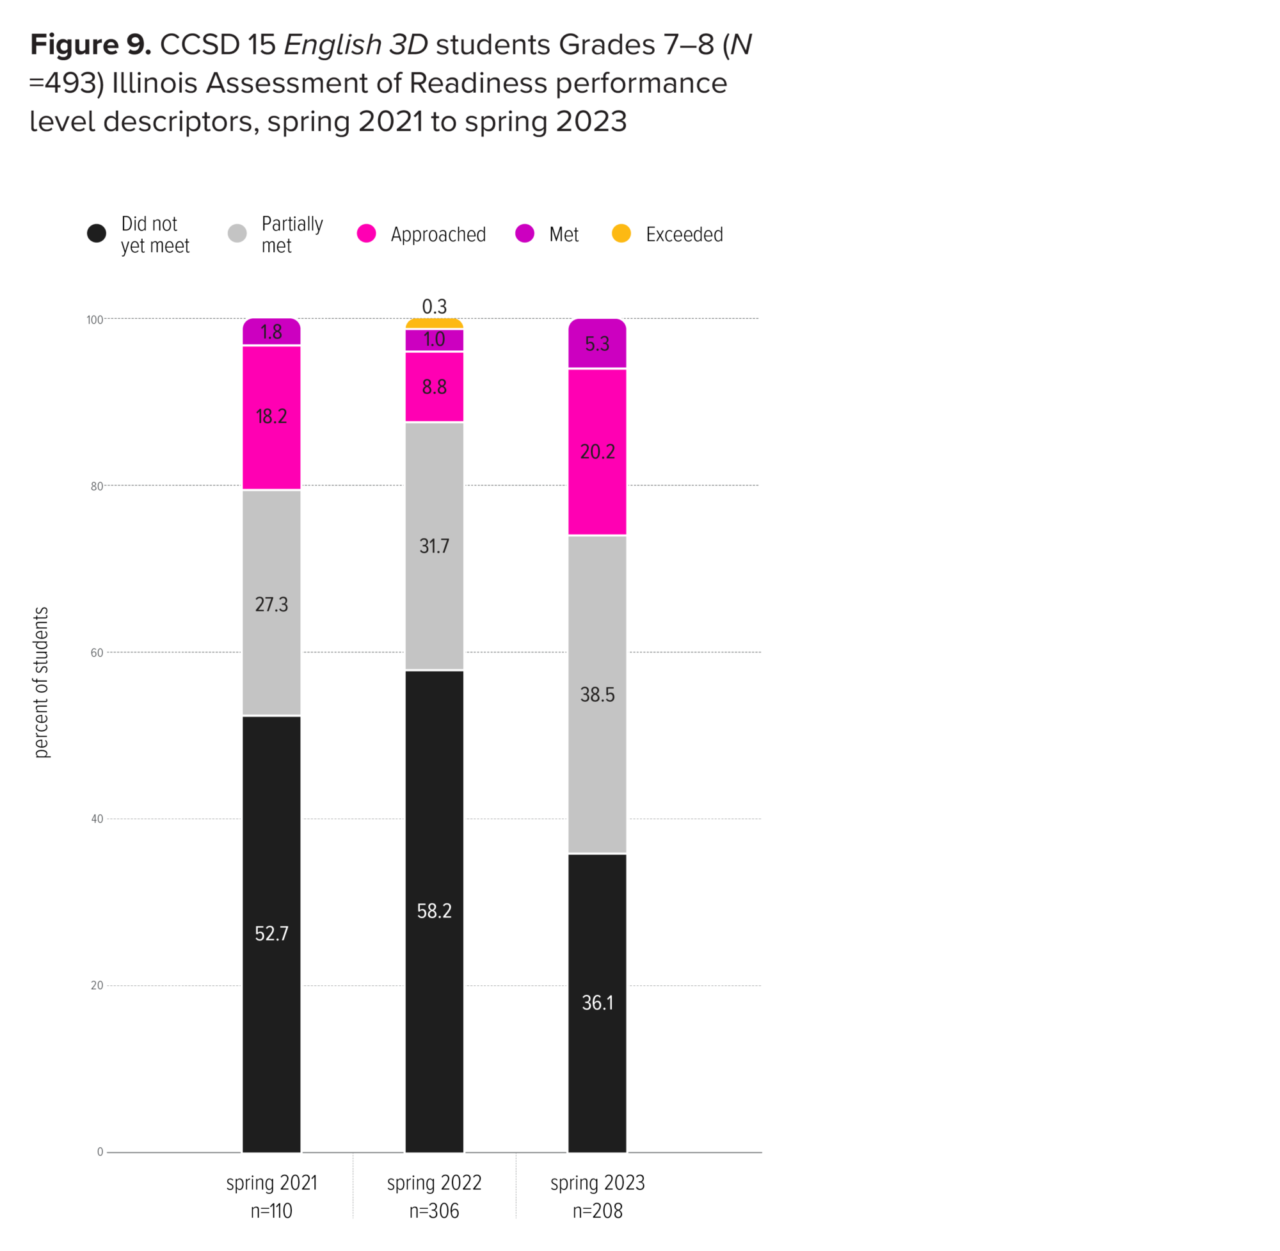
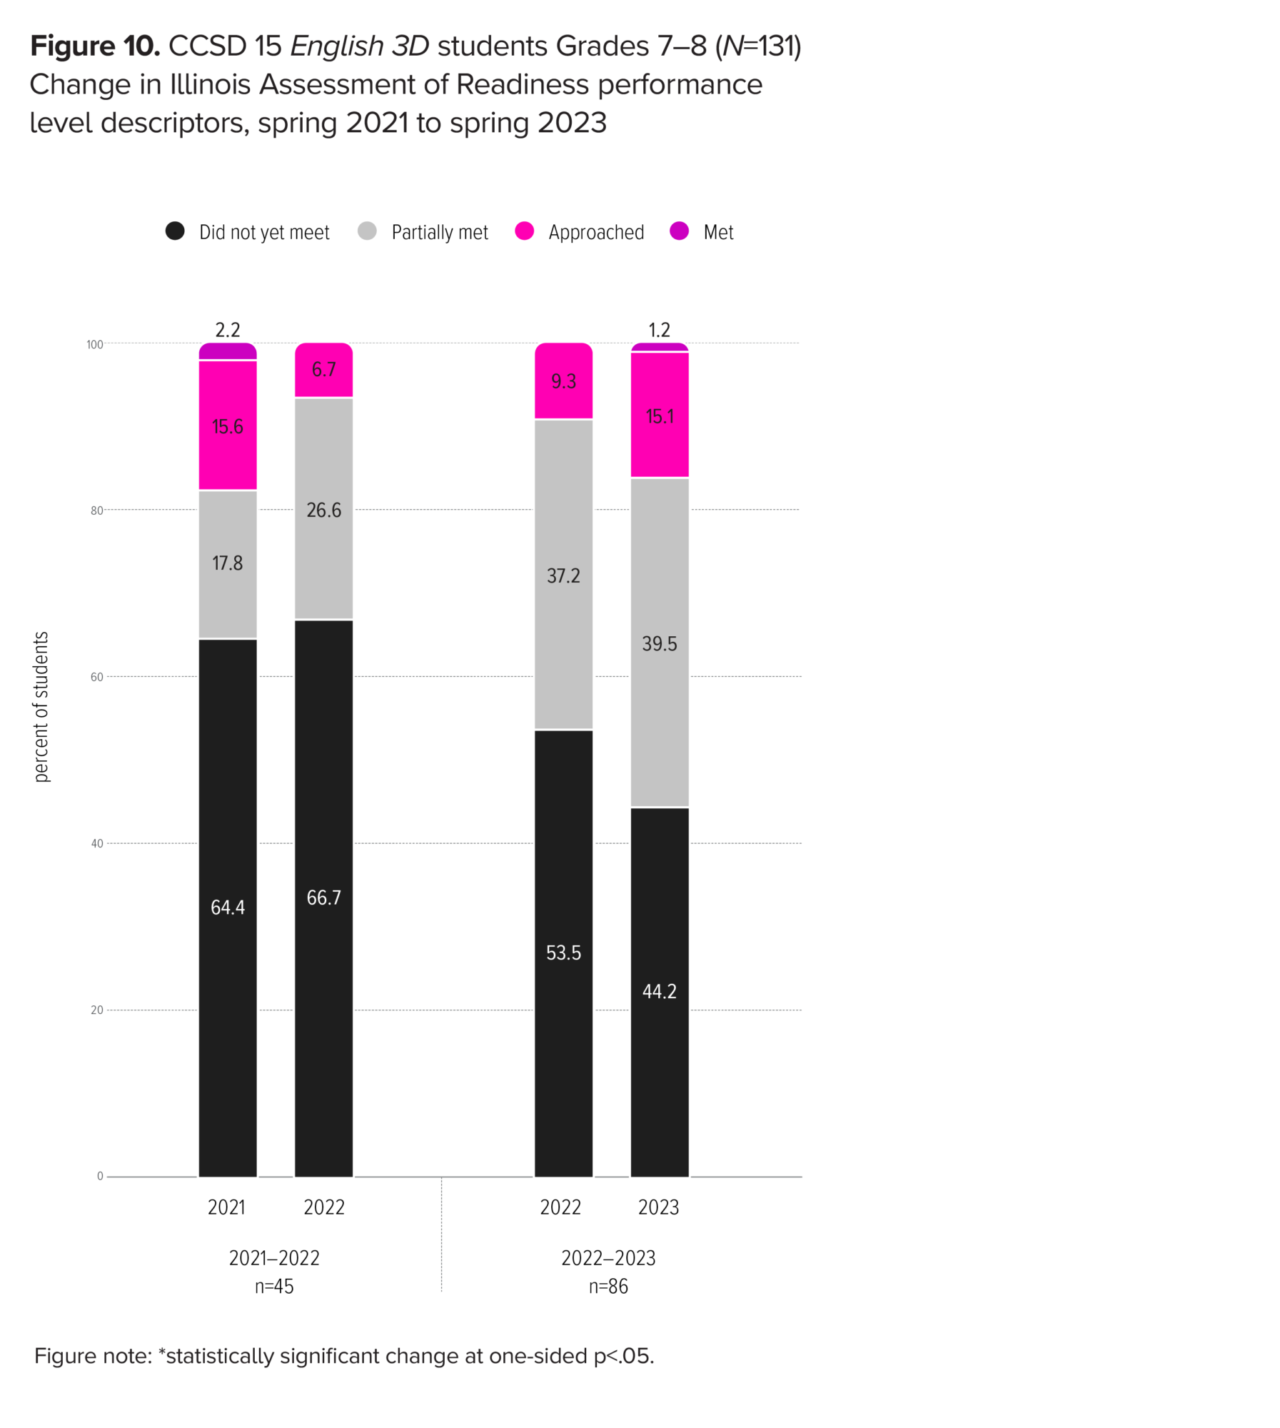
Student IAR Performance Level Descriptors indicated that among students who completed the IAR in both school years (N=45), 2% of the English 3D students Met grade-level ELA expectations and another 16% Approached grade-level ELA expectations in the 2020–2021 school year (see Figure 9) and 0% Met grade-level ELA expectations while 7% Approached grade-level ELA expectations in the 2021–2022 school year. From year two to year three of implementation, however, performance level descriptors increased among students who completed the IAR in both school years (N=86), where 0% of the English 3D students Met grade-level ELA expectations and another 9% Approached grade-level ELA expectations in the 2021–2022 school year (see Figure 10) and 1% Met grade-level ELA expectations while 15% Approached grade-level ELA expectations in the 2022–2023 school year.
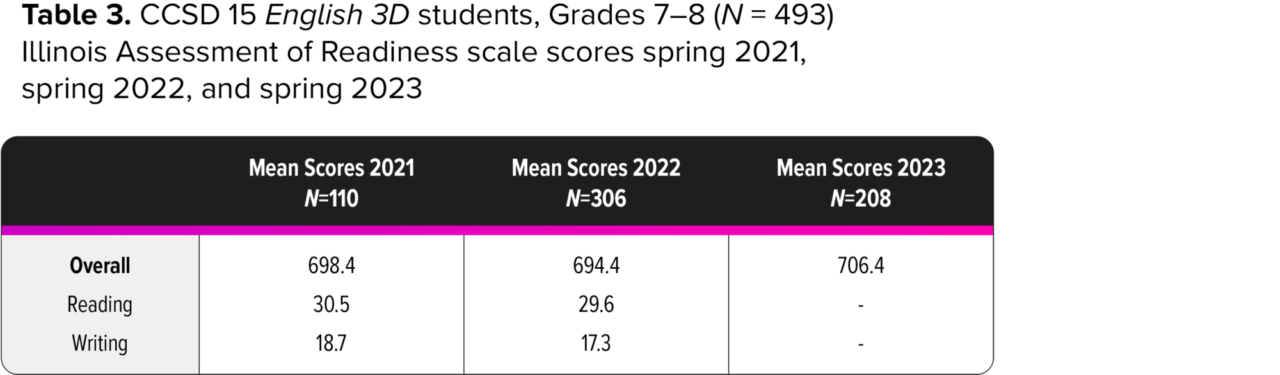
Overall English 3D student IAR scores were slightly lower in year 2 as compared to year 1, reflecting the different populations of English 3D participants (see Table 3). On average, students earned overall scale scores of 698, reading scale scores of 30.5, and writing scale scores of 18.7 in the 2020–2021 school year. On average, students earned overall scale scores of 694, reading scale scores of 29.6, and writing scale scores of 17.3 in the 2021–2022 school year. On average, students earned overall scale scores of 706 in the 2022–2023 school year.
Higher-performing seventh- and eighth-grade CCSD 15 EL students received English 3D instruction during the 2020–2021 school year and both lower-performing and higher-performing EL students received English 3D instruction during the 2021–2022 and 2022–2023 school years. The available ELA data is consistent with the idea that students who received English 3D instruction made important improvements in English Language Arts and Literacy achievement.
During each year of implementation, CCSD 15 students in seventh and eighth grade who received English 3D instruction demonstrated statistically significant increases in MAP Reading RIT scale scores. Of note, these gains were achieved by students in each demographic category of gender, ethnicity, eligibility for the Free or Reduced-Price Lunch program, and Students with Disabilities classification. Further, English 3D students achieved greater MAP Reading RIT scale score gains than would be predicted based on national growth norms, averaging 5.5-point gains compared to the expected 3.7-point gains in the 2020–2021 school year, 4.4-point gains compared to the expected 3.9-point gains in the 2021–2022 school year, and 4.7-point gains compared to the expected 3.9-point gains in the 2022–2023 school year. Despite beginning at a disadvantage, English 3D students demonstrated school-year growth equal to their non-English Learner peers on the MAP Reading assessment in each year. These typical grade-level gains were achieved despite students moving between in-person and hybrid learning during the 2020–2021 school year and in contrast with the typically found widening achievement gap between students classified as EL and non-EL students during the junior high school years (NAEP, 2017). Further, 19%–22% of English 3D students demonstrated accelerated ELA growth each year, achieving a gain of 10 or more percentile points from fall to spring MAP Reading assessment.
English 3D students who completed the exam in two years also demonstrated statistically significant year-to-year gains in ACCESS overall scale scores and in each domain of writing, reading, listening, and speaking. English 3D students demonstrated notable ACCESS overall composite proficiency level increases, and importantly, between 19%–27% of students each year achieved a “Bridging” or higher proficiency level, indicating an ability to access grade-level curriculum. Further, the percentage of CCSD 15 EL students who achieved a proficiency level of 4 or greater has increased each year following English 3D implementation, in contrast to state-wide decreases in overall composite proficiency levels during the same time period. ACCESS testing was conducted after a full year implementation of English 3D in the 2020–2021 school year, a partial year implementation of English 3D in the 2021–2022 school year, and a full year implementation of English 3D in the 2022–2023 school year, at which point 12% (20/173), 3% (9/312), and 13% (27/209) of students achieved an overall composite performance level greater than 4.8, indicating readiness to end EL services (reclassification).
Though summative assessments do not capture ELA growth occurring far below grade-level proficiency well, the end-of-year state summative assessment (IAR) scores showed notable growth for these EL students; the percentage of English 3D students who “met” grade-level ELA expectations increased from 1.8% in the 2020–2021 school year to 5.3% in the 2022–2023 school year. The strong correlations between the IAR and the interim MAP Reading assessment scores further suggest that as English 3D students continue to make MAP Reading score gains, they will also make IAR score gains.
These study results, corroborated by CCSD 15 employee feedback, provide evidence that using English 3D to improve English language development is an effective method of increasing literacy for EL students struggling to achieve grade-level ELA proficiency.
“Dr. Kinsella’s research and curricular tool is unmatched for language development. It makes a life-changing difference for both the teacher and the students and is sorely missing in most ELA programs.“
– CCSD 15 Employee
“[English 3D was effective for English Learners] . . . because it provides a very scaffolded approach to developing the 4 domains of language.”
– CCSD 15 Employee
U.S. Department of Education. National Department of Educational Progress (NAEP). (2017). The Nation’s Report Card: 2017 Reading Assessment. Washington, DC: U.S. Department of Education.