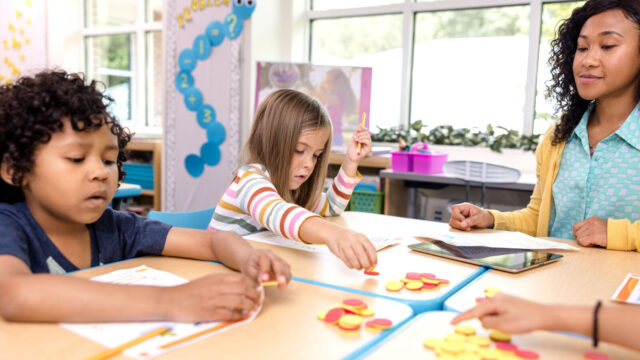
The Importance of Data
Data literacy is so essential right now, a point emphasized in a joint position statement of the National Council of Teachers of Mathematics (NCTM) and the American Statistical Association (ASA): “As our society becomes increasingly data intense and information based, statistical literacy skills are all the more important for today’s citizens and a competitive work force.”
More than being essential, questions surrounding data are perhaps some of the most open-ended questions that can be found in math class. There are many entry points regarding how to interpret it. Not only can data be parsed in seemingly endless ways, it relates to every other discipline. Projects on data can be centered around student curiosity and relate especially well to scientific thinking. Consider examples like counting words in a speech, analyzing money spent, or tracking student performance across a school.
By studying how to collect, represent, and interpret data in first and second grade, students are learning math that sets them up for success in future careers that may not even exist yet and doing so early in their education careers.
The subject of data is often moved to the end of a scope and sequence, sometimes being ignored completely in an effort to get through other standards. This may not be surprising, as state exams often have the fewest questions in statistics, and occasionally the subject of data doesn’t even come up in math class until after the state exam!
Introduction to Data
Consider first asking students about things to collect or gather. This could be collections that they have themselves, for example collections of seashells, rocks, or toys. It could also be about objects that other people gather, for example a biologist collecting specimens.
When gathering objects, how would you or someone else organize them? How would they figure out exactly how many of each object there is? If they had, say, a collection of hundreds of seashells of all different sizes, colors, and shapes, what are some ways they could figure out exactly how many of each type they had?
Lesson Plans for Representing and Interpreting Data
The two activities below both come from our HMH Into Math lessons for Grades 1 and 2. They are from the “Spark Your Learning” activities that introduce many topics and promote conceptual understanding. Both activities involve representing data as tally marks and then interpreting what those marks mean. In addition to helping students create structure, it helps them improve their mental math skills. Tally marks help students understand how to chunk into units and skip count by 5s or 10s. Tally marks also help with comparison; it is usually easy to tell when one set of tally marks is greater or less than another.
The first activity, “Interpret Tally Charts,” is intended for first graders. It helps students create structure.

The second activity, “Collect and Record Data,” is intended for second graders. It may help to remind students first that this activity is not substantively different than other ways they’ve sorted or counted before. They’ve already had to sort and count snap cubes!

Reflecting on Tally Marks
Tally marks are one way to keep track of data and count how many there are of an object. What is being counted is not as important as how it is being represented. One follow-up activity that you can facilitate is giving pairs of students the same collection (for example, “18 cat toys and 24 dog toys”), with one student being assigned “tally marks” and the other “pictographs,” but not telling students who they are paired with. One student represents the collection with tally marks, and the other student uses pictographs. Then task students with matching their collection with the same one represented differently. Listen to how they discuss the representations. How do they find their partner?
Making tally marks may seem like just a convenient way to keep track of data by hand. But it is an entry point into a much bigger idea. Students are organizing objects and representing them abstractly. The same principle of counting cat toys can be extended to counting countries, biomes, or demographics. Collecting data doesn’t just help us compare toy collections, it helps us understand the world in a tangible way.
***
Grow student confidence in mathematics with HMH Into Math, our core math solution for Grades K–8.
Get our FREE guide "Optimizing the Math Classroom: 6 Best Practices."

